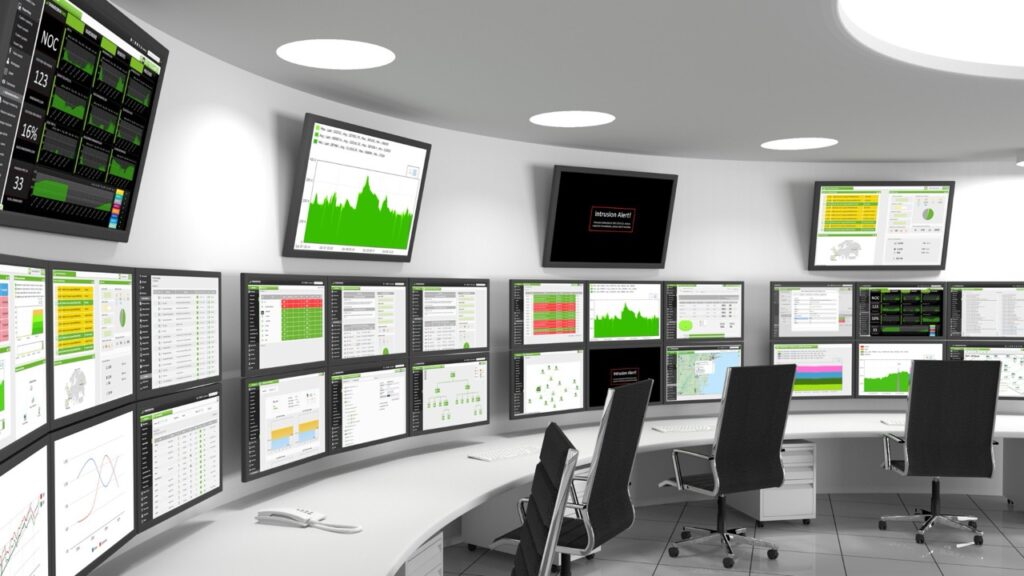
What is a Project Dashboard?
A project dashboard is a customizable visual interface that consolidates and displays critical project data, metrics, and KPIs in real-time. Think of it as your project’s cockpit—a central command center where all essential information is organized and easily accessible at a glance. Unlike traditional project reports or spreadsheets, dashboards provide dynamic, real-time visibility into project performance, making it easier to track progress, identify bottlenecks, and make data-driven decisions.
The Power of Visual Project Management
The human brain processes visual information 60,000 times faster than text, making dashboards an invaluable tool for project management. A well-designed project dashboard transforms complex data into intuitive visual representations that enable quick comprehension and faster decision-making. This visual approach to project management offers several key advantages:
- Instant Overview: Rather than digging through multiple reports or spreadsheets, stakeholders can immediately grasp project status and performance through visual indicators.
- Real-time Monitoring: Live data updates ensure that project managers and team members always have access to the most current information, enabling proactive problem-solving.
- Enhanced Communication: Visual representations help bridge communication gaps between technical and non-technical stakeholders, ensuring everyone shares the same understanding of project status.

Essential Components of an Effective Dashboard
A successful project dashboard combines three critical elements that work together to provide comprehensive project visibility.
Visual Widgets
Charts, graphs, and other visual elements that transform raw data into easily digestible information. These might include:
- Progress bars for task completion rates
- Burndown charts for sprint tracking
- Gantt charts for timeline visualization
- Resource allocation heat maps
Real-time Data Integration
Automatic data updates ensure that dashboard information remains current and reliable, enabling informed decision-making based on the latest project status.
Customization Options
The ability to tailor the dashboard to specific project needs and stakeholder preferences ensures that the most relevant information is always front and center.
Creating an Effective Project Dashboard
Developing a powerful project dashboard requires thoughtful planning and execution. Here’s how to create a dashboard that drives project success.
Define Key Metrics
Start by identifying the most critical project metrics and KPIs that need tracking. These might include:
- Task completion rates
- Budget utilization
- Resource allocation
- Timeline adherence
- Risk indicators
Choose Appropriate Visualizations
Select visual representations that best communicate your data. Consider your audience’s needs and preferences when choosing between different visualization options.
Organize Information Strategically
Arrange dashboard elements in a logical flow, placing the most critical information in prominent positions. Use visual hierarchy to guide viewers’ attention to the most important metrics first.
Maximizing Dashboard Impact
To get the most value from your project dashboard, consider these best practices:
- Keep it Simple: While it’s tempting to include every possible metric, focus on the most critical information to avoid overwhelming users. Remember, the goal is clarity, not complexity.
- Update Regularly: Ensure your dashboard remains relevant by regularly reviewing and updating its components based on project evolution and team feedback.
- Enable Drill-Down Capabilities: While high-level metrics are important, users should be able to dig deeper into the data when needed for detailed analysis.
Leveraging Dashboards for Project Success
Project dashboards are more than just pretty visualizations—they’re powerful tools for driving project success. When properly implemented, dashboards can:
- Improve Decision-Making: Quick access to critical data enables faster, more informed decisions.
- Enhance Team Alignment: Shared visibility into project status keeps everyone working toward the same goals.
- Facilitate Stakeholder Communication: Visual representations make it easier to communicate project status to stakeholders at all levels.
- Enable Proactive Management: Early warning indicators help identify potential issues before they become serious problems.
By implementing a well-designed project dashboard, organizations can transform their project management approach from reactive to proactive, ensuring better project outcomes and increased team efficiency. Remember, the key to success lies not just in having a dashboard, but in creating one that truly serves your project’s unique needs and objectives.


